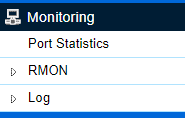
To display the Monitoring settings of the Linksys Managed Gigabit Switch, follow the steps below.
Note that if the images you see or the steps you follow look different from the actual page, here are alternative instructions/information.
2. Click on Monitoring.

3. The following settings can be found under Monitoring:
Port Statistics
RMON
Port Statistics
To see more columns (left or right), click on the blue arrows 
 . Click Clear to clear the packet counters on specific ports.

- Port: Displays the port for which statistics are defined.
- RXOctects: Displays the number of all packets received on the port.
- RXUcast: Displays the number of unicast packets received on the port.
- RXNUcast: Displays the number of non-unicast packets received on the port.
- RXDiscard: Displays the number of received packets discarded on the port.
- RXMcast: Displays the number of multicast packets received on the port.
- RXBcast: Displays the number of broadcast packets received on the port.
- TXByte: Displays the number of all packets transmitted on the port.
- TXUcast: Displays the number of unicast packets transmitted on the port.
- TXNUcast: Displays the number of unicast packets transmitted on the port.
- TXDiscard: Displays the number of transmitted packets discarded on the port.
- TXMcast: Displays the number of multicast packets transmitted on the port.
- TXBcast: Displays the number of broadcast packets transmitted on the port.
RMON
Remote Network Monitoring (RMON) is used for support monitoring and protocol analysis of LANs by enabling various network monitors and console systems to exchange network monitoring data through the switch.
Under RMON, you can configure the following settings:
Click Apply to accept the changes or Cancel to discard them.

- Index: Enter the entry number for the event.
- Data Source: Select the data source from the port.
- Owner: Enter the switch that defined the event.

- Index: Enter the entry number for the event.
- Event Type: Select the event type.
- Log: The event is a log entry.
- SNMP Trap: The event is a trap.
- Log & Trap: The event is both a log entry and a trap.
- Community: Enter the community to which the event belongs.
- Description: Displays the number of good broadcast packets received on the interface.
- Last Time Sent: Displays the time that the event occurred.
- Owner: Enter the switch that defined the event.
Event Log Table
From here, you can view specific event logs for the switch. Choose an event log you wish to view from the drop-down list.

Alarm List
You can configure network alarms to occur when a network problem is detected. Choose your preferences for the alarm from the drop-down boxes.

- Index: Enter the entry number for the Alarm List.
- Sample Port: Select the port from which the alarm samples were taken.
- Sample Variable: Select the variable of samples for the specified alarm sample.
- Sample Interval: Enter the alarm interval time.
- Sample Type: Select the sampling method for the selected variable and compare the value against the thresholds.
- Absolute: Compares the values with the thresholds at the end of the sampling interval.
- Delta: Subtracts the last sampled value from the current value.
- Rising Threshold: Enter the rising number that triggers the rising threshold alarm.
- Falling Threshold: Enter the falling number that triggers the falling threshold alarm.
- Rising Event: Enter the event number by which the rising alarms are reported.
- Falling Event: Enter the event number by which the falling alarms are reported.
- Owner: Enter the switch that defined the alarm.

- Index: Enter the entry number for the History List.
- Sample Port: Select the port from which the history samples were taken.
- Bucket Requested: Enter the number of samples to be saved. The range is from 1 to 50.
- Interval: Enter the time that samples are taken from the ports. The field range is from 1 to 3600.
- Owner: Enter the RMON user that requested the RMON information. The range is from 0 to 32 characters.
History Log Table
From here, you can view the History Index for history logs on the switch. Select a History Index to view from the drop-down box.

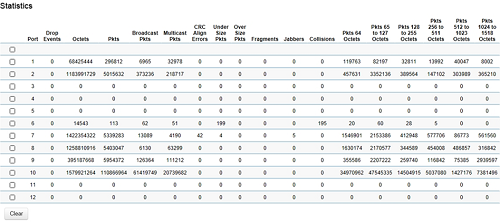
From here, you can view all the RMON statistics of the switch.

- Port: Indicates the specific port for which RMON statistics are displayed.
- Drop Events: Displays the number of dropped events that have occurred on the port.
- Octets: Displays the number of octets received on the port.
- Pkts: Displays the number of packets received on the port.
- Broadcast Pkts: Displays the number of good broadcast packets received on the port. This number does not include Multicast packets.
- Multicast Pkts: Displays the number of good Multicast packets received on the port.
- CRC Align Errors: Displays the number of CRC and Align errors that have occurred on the port.
- Under Size Pkts: Displays the number of undersized packets (less than 64 octets) received on the port.
- Over Size Pkts: Displays the number of oversized packets (over 1518 octets) received on the port.
- Fragments: Displays the number of fragments received on the port.
- Jabbers: Displays the total number of received packets that were longer than 1518 octets.
- Collisions: Displays the number of collisions received on the port.
- Pkts of 64 Octets: Displays the number of 64-byte frames received on the port.
- Pkts of 65 to 127 Octets: Displays the number of 65 to 127-byte packets received on the port.
- Pkts of 128 to 255 Octets: Displays the number of 128 to 255-byte packets received on the port.
- Pkts of 256 to 511 Octets: Displays the number of 256 to 511-byte packets received on the port.
- Pkts of 512 to 1023 Octets: Displays the number of 512 to 1023-byte packets received on the port.
- Pkts of 1024 to 1518 Octets: Displays the number of 1024 to 1518-byte packets received on the port.
Log
The Syslog protocol allows devices to send event notification messages in response to events, faults, or errors occurring on the platform as well as changes in configuration or other occurrences across an IP network to Syslog servers. It then collects the event messages, providing powerful support for users to monitor network operations and diagnose malfunctions. A Syslog-enabled device can generate a Syslog message and send it to a Syslog server.
Syslog is defined in RFC 3164. The RFC defines the packet format, content, and system log-related information of Syslog messages. Each Syslog message has a facility and severity level. The Syslog facility identifies a file in the Syslog server. Refer to the documentation of your Syslog program for details.
The following describes the Syslog severity levels:
| Code | Severity | Description | General Description |
| 0 | EMERG | System is unusable | A "panic" condition usually affecting multiple apps, servers, and sites. At this level, it would usually notify all technical staff on call. |
| 1 | ALERT | Action must be taken immediately | Should be corrected immediately. Therefore, notify staff who can fix the problem. An example would be the loss of a primary ISP connection. |
| 2 | CRIT | Critical conditions | Should be corrected immediately. Indicates failure in a secondary system. An example is a loss of a backup ISP connection. |
| 3 | ERROR | Error conditions | Non-urgent failures; these should be relayed to developers or admins. Each item must be resolved within a given time. |
| 4 | WARNING | Warning conditions | Warning messages, not an error, but an indication that an error will occur if action is not taken, e.g., file system 85% full - each item must be resolved within a given time. |
| 5 | NOTICE | Normal but significant condition | Events that are unusual but not error conditions; might be summarized in an email to developers or admins to spot potential problems; no immediate action is required. |
| 6 | INFO | Informational messages | Normal operational messages; may be harvested for reporting, measuring throughput, etc. No action required. |


